Even before HCAHPS solidified the focus, there has been a twenty-year evolution away from mean scores and towards a focus on top-box percentages in healthcare. This shift started with an article by Frederick Reichheld called “One Number You Need to Grow” published in 2003 by Harvard Business Review.1 Between what Reichheld stated explicitly as well as what can be implied by the article, Reichheld has had a larger impact on healthcare patient experience than anything else since social science research methodology arrived in the space in the early 1980s.
Some things Reichheld wrote about were invaluable in reshaping the understanding of the patient experience.2 For example, focusing on the percentage of people who gave the highest score to a question (what I will refer to as a ‘top-box’ response) allowed organizations to more clearly see the value in improvement since anyone familiar with tracking mean scores know that they move incrementally and slowly.3 A million years ago, when I worked at Professional Research Consultants, we identified that the standard-bearers in healthcare (Mayo, Johns Hopkins, etc.) had marginally better mean scores, but what really showed their performance was the percentage of top-box scores they received over other hospitals. While a mean score of 3.8 is better than a mean score of 3.6, that failed to capture what these hospitals were doing. But when comparing their top-box scores of 80% versus 65%, it gave more understanding to their overall performance.
The implication of this focus is that value of satisfaction is not linear. That is, when trying to improve a mean score, moving someone from a 5 to a 6 had the same value to a mean score as moving a 8 to a 9. Each step up the ladder was equivalent. But common sense (and Fred Reichheld) knew that there was a palpable difference between the value in moving someone from *meh* to slightly more *meh* and moving someone from ‘like’ to ‘love.’ While we want all patients to have a better experience today than they had a year ago, what we really want are patients who are so impressed with their care that they will do what we want them to do after they are discharged.
Along with this, though, came a few more things that I do not think have served healthcare very well. For example, this work has shifted focus away from Overall Quality in many conversations and to Likelihood to Recommend. While this is certainly a sexy target from a marketing perspective, it has less meaning and motivational impact to a frontline staff member.
- First, all the hospitals I have worked with are already busy. Hospital systems across the country have trouble with access. We have boarders in the emergency department. We have six- to eight-week waits for primary care appointments, with the waiting time for specialty appointments being even more extended. Staff already feel overworked. So, if you tell your staff, “Hey! We want MORE patients!” their response is likely going to be earthy and brief.
- Second, hospitals have several things that drive preference, from convenience and access to insurance coverage. If a patient says that they would not likely recommend a hospital, that answer may be based upon any number of things that a hospital can do nothing about.4
So, while marketing teams love likelihood to recommend, I don’t really care. I care about the ability to keep frontline staff focused on the work at hand and not complaining about the value of the question we are chasing. With all due respect to healthcare marketing teams, your influence on a patient’s perceptions of care is dwarfed by the importance of the clinical and even non-clinical staff at a hospital, so that is the audience I am primarily focused on motivating.
The other element that I am not sanguine about is the focus on net promoter score (NPS). This is taking the existing percentages and creating a comparison measure by subtracting the percentage of people who are unhappy from the percentage of people who are happy. For those who are not familiar with this concept already, allow me this simple summary. NPS starts with an 11-point scale question and separates the responses into three buckets. The 0, 1, 2, 3, 4, 5, and 6 responses are grouped into a Detractor group. The 7 and 8 responses are grouped into a Neutral or Passive group. The 9 and 10 responses are grouped into a Promoter group. Looking at the most-recent CMS data, the 50th percentile for each of these groups are 8%, 20% and 72% respectively. So, the NPS would be 72%-8% or 64%.
There are three reasons why I don’t like the use of NPS on hospital data.
- It confuses the action planning process. As mentioned in a previous article, service recovery is not service excellence. NPS implies that we should be working on both, but most hospitals can barely build consistent behavior on one service action plan, so creating two seems infinitely less helpful.5
- By extension, it assumes that work on both promoters and detractors is equally helpful. In practice, since staff struggle to understand how to “wow”, they will focus on simply not pissing off patients so much. This, though, doesn’t work. In part because of what I said in the last essay, and in part because it is a lot harder to move someone from ‘1’ all the way to ‘7’ than it is to move someone from ‘8’ to ‘9’.
- Finally, the people in the Detractor category have two traits that make this even harder. First, in healthcare, there are not many of them. Look at the numbers I cited above for the 50th percentile. If you want to improve your NPS by 5%, you have two options. You need to convert 5% of your neutral patients to promoter patients, which means converting (5%/20%) 25% of the available neutral patients. Or, you need to convert 5% of your detractors into neutral, which is converting (5%/8%) 62.5% of the available detractors. So you can convert a minority of patients who are looking for an opportunity to love you, or, you convert a significant majority of those patients who are remarkably difficult to move.
Patient experience is trying to get frontline staff to (a) believe PX is important, (b) believe that they can do simple things to move the needle, and (c) think that all of this is in service of a worthy goal. None of this work is made easier by confusing frontline staff with numbers and action plans that don’t make intuitive sense. NPS just muddies the water.
All of this is a long winding path to a point I made previously, which is that organizations cannot grow their HCAHPS scores by focusing on service recovery. To prove this, I will give you two examples, one specific to a hospital and one general to the broader data.
Example 1: Why You Cannot Do It
In order to explore why the average hospital cannot do this, we will use the median data listed above (Promoters (72%), Neutral (20%) and Detractors (8%)) and make a few reasonable assumptions.
- Fact 1: We will use the median scores listed above (Promoters (72%), Neutral (20%) and Detractors (8%)) for this example.
- Reasonable Assumption 1: The discharges for our hospital will be 20,000 a year.
- Reasonable Assumption 2: The hospital logs 1000 complaints in a year. This is more than I see for a hospital this size, but I don’t want to shade the data to make my point easier to make.
- Reasonable Assumption 3: The hospital closes about 50% of complaints within 5 business days, and about 75% closed within 30 business days.
At the end of the year, the General Hospital (GH) top-box score for Overall Hospital Rating was 72% and their NPS was 64%. Leadership tasks the organization to improve by 5% for the upcoming year. The question is, can they make this leap by focusing exclusively on service recovery?
If we assume that the percentages measured by the survey reflect reality, we know that at GH:
- 14,400 patients are Promoters (20,000 * 72%)
- 4,000 patients are Neutral (20,000 * 20%)
- 1600 patients are Detractors (20,000 * 8%)
Let us assume that all 1,000 complaints logged in GH’s safety portal were from detractors. This means that 62.5% (1,000 complaints logged / 1,600 total detractors) of detractors were known to us and by extension 37.5% of Detractors were not known to us. It is important to realize that, if we are focusing on detractors here, we can only focus on those who we KNOW are detractors.
Some assumptions that we CANNOT make are:
- Every complaint will be resolved to a patient’s satisfaction
- The patient’s satisfaction will be enough to move a response from Detractor to Neutral. We may be able to convince a patient who was the subject of a medical error or whose grandmother’s diamond ring was lost to not sue us, but it is unlikely that they will actually move to a 7 or an 8 on the scale.
- That we will be able to address the concern to their satisfaction before they get or take the survey.
Let us assume a best-case scenario, where 80% of patients are happy with their complaint resolution and that 80% of patients got the resolution in time to take the survey and 80% were so happy with the results to move them from detractor to neutral. This means that we can assume that we moved (80%*80%*80%) 51.2% of the detractors to neutral, which means (51.2% *1000) 512 patients. So, the new number will be:
- 14,400 patients are Promoters (72%)
- 4,512 patients are Neutral (22.56%)
- 1088 patients are Detractors (5.44%)
- NPS would improve, from 64% to 66.6%.
With assuming the absolute best-case scenario, the NPS moves about half of the way we would need to meet goal. A more realistic goal would be 60% satisfied/75% within the survey window/50% satisfied enough to move out of the 0-6 range. Here, we would convert 22.5% of the complaints, meaning that our Detractors drop from 1600 to 1375 (6.8%) and the NPS would move from 64% to 65.2%. One can play with the numbers in a hundred different ways, but there are three things that are going to limit this calculation.
- First, are all the things that need to fall in General Hospital’s favor to convert a detractor to a neutral—a timely resolution that so impresses a patient as to move them from hating us to liking us.
- Second, the fact that none of this is touching the 600 patients who were dissatisfied with GH, but GH never knew about, because they never complained.
- Third, none of the service recovery work will impact anyone other than those 600 patients, so there is no collateral value.
In fact, the ONLY way GH can meet goal is to convert 100% of those 1,000 complaints into 7s or 8s. If that happened, then the Detractors would drop to 3% and the overall score would be 69%, which would be a 5% increase. Anything short of perfection means a failure.
One might say that I fudged the numbers above just so it would appear that it cannot be done. If you believe that, I encourage you to insert your own hospital’s numbers, calculate your score and tell me in the comment section how wrong I am. I picked numbers that were as optimistic as I have seen, but let me know if you can do better.
Example 2: Why No One Can Do It
Everything in the example above is based upon assumptions, so you might imagine that if those assumptions were different, or, if an organization worked hard enough, they could win by just not losing as often. But, if that were the case, if one could do that, why hasn’t anyone done it? Even high-performing hospitals still have crabby patients. I calculated the percentiles from the HCAHPS data and put them in the table below. Note that these are percentiles based exclusively on the score for that NPS category, so while the horizontal lines are close to 100% in each case, you should not expect them to add up to exactly 100% in each case.
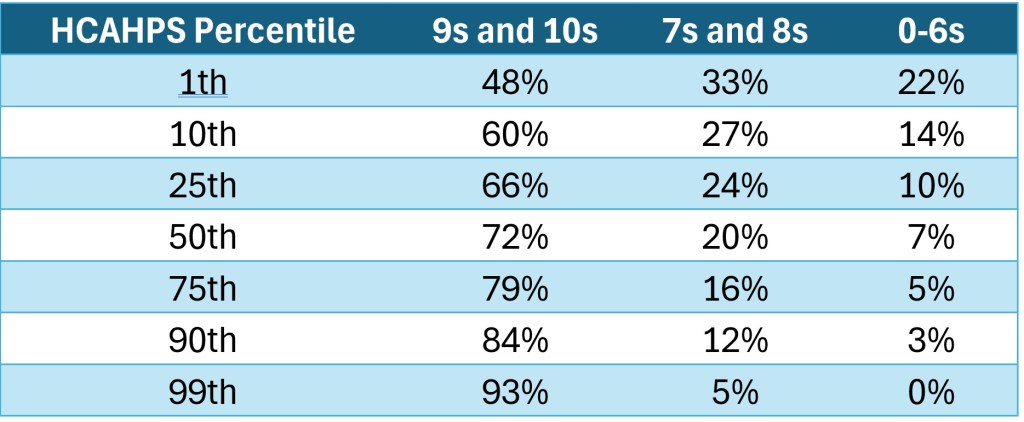
Not surprisingly, we see that as promoters go up, both neutral and detractors goes down. But also notice how pernicious the detractors are. Most organizations peg performance to either the 50th or the 75th percentile, depending on where they are on their improvement journey. But notice that a massive move from median to top-quartile has a measly 2% drop in dissatisfied patients. Notice, further, that another fifteen percentile points (75th to 90th) sees another small drop in dissatisfied patients. Let that sink in—the patient experience standard-bearers, top 10%, the places that most of us would dream of working at, still have 3% of their patients that are upset. If THEY cannot move those patients from crabby to *meh*, we might have to accept that they cannot be moved. Heck, if you consider sample sizes, the difference between the 75th (7%) and the 90th (3%) is likely within the measurement margin of error. So, the difference in dissatisfaction between the awesome and the average is random luck.
What makes the awesome awesome? What makes THEM different from US? THEY realize that scores don’t improve because there are fewer crabby apples. They learn to manage those folks and dedicate real energy to making things better for the rest. Notice that the real gain from the 50th to the 75th in top-box scores come primarily from converting the 8s to 9s. THIS is how organizations get better and sustain that improvement. Further, while service recovery does not have any collateral value, this focus on moving 8s to 9s is ALL collateral value.
Bottom Line: Why It is Not Worth Trying
Let us say General Hospital converts every single complaint into a neutral and they meet goal for the next year. So, the leadership moves the goal up another 5%. Given the model, where is this 5% coming from? Working at perfect efficiency got you to the top of what was available. GH could try and capture more of those dissatisfied patients who do not complain, but it is not clear how they could do that. If it were a situation where people were fielding complaints but not documenting them, you might have room to move. But, if patients are simply suffering in silence, there is not much to do to force them to talk.
Don’t get me wrong. I like Reichheld’s article and I think it has done great things in bringing useful concepts and data to improving the patient experience. I am, however, still concerned that those who do not understand how service works in healthcare will direct work in areas that won’t bear the fruit that an organization demands. Focus on the top-box. Focus on the things that really wow a patient. Do not let your PX journey devolve into a game of whack-a-mole, where 95% of your energy is focused on resolving 5% of your patients’ needs and knowing that this 5% is never going away.
1Reichheld, Frederick F. (December 2003). “One Number You Need to Grow”. Harvard Business Review. 81 (12): 46–54, 124. PMID 14712543.
2I should note that Reichheld’s primary focus was on improving customer satisfaction, but I will primarily talk about its impact on patient satisfaction.
3One could argue, though, that the pendulum swung too far the other way, as small shifts in percentages, even those well within the margin of error, can be seen as reasons to demand action plans and call leaders to the woodshed.
4Attentive readers will know that I hate it when people push away ownership by saying, “I can’t do anything about that!” because usually there is something that they can do. But staff can literally do nothing about whether an insurance company decrees a health system in or out of network.
5I say infinitely less helpful because if you give me ONE thing to do in addition to my ‘real’ work, I can probably do it well. If you give me TWO things to do in addition to my ‘real’ work, I will probably not do either one particularly well. It is subtraction by addition.

Leave a comment