While some statistical concepts are freely used in clinical and popular settings, sometimes the underlying importance or impact of these terms on those conversations are not fully appreciated. Even in math-literate conversations, like between statisticians and clinicians, some terms have similar meanings in their respective universes, but carry different weights, so even there, miscommunication can occur. I am reminded back to my spa day, when one of my doctors was excited to learn that I was in ‘healthcare research’ until he realized it was patient experience data collection. Never have I seen a facial expression go from excitement to dismay more quickly. To highlight some communication pitfalls when talking about statistics, I will create an on-going series, where I will explore statistical terms and discuss the potential misunderstanding when the same word is used in different contexts by different people.
There is no better starting place than with the word significance. The concept of significance is the bedrock of statistical analysis. Even so, it is a word used often without really understanding the subtext that it brings.
Since a vast majority of social science work is done with samples of populations and not entire populations, there is a high premium on whether one can determine if an observed difference is real or simply an artifact of measurement. In other words, significant or within the margin of error. The margin of error references the fact that if we were to conduct the same survey from a different random sample of the same population, we would not likely get the same result but would get a result that was proximate to the first number. So, some differences in scores are simply based upon the random group surveyed. If the difference between two numbers is greater than this margin of error, we will call those differences real or statistically significant. There are a lot of things that feed into this calculation, and I am not going to explore many of them here.
My primary concern over the concept of significance is that it is often treated as a conversation stopper. Something is significant or it is not1 and you can hate it, but you cannot argue against it. This, though, ignores the fact that while it might be mathematically true, if one does not explore the “what” or the “why” of this analysis, this fact may not be important. I describe this as the difference between statistically significant and conversationally significant. Just because something is statistically significant does not mean it is worth talking about. Just because something is not statistically significant does not mean it is NOT worth talking about.
One of the places where this more apparently is when the dataset is large. Significance is a comparison of observed differences when factoring in the number of datapoints included in the equation. With a large dataset, we can see smaller differences be significant, but we don’t always ask whether these differences are worth talking about. This is especially problematic when this research reported in the mainstream media.
For example, consider the possible connection between aluminum to Alzheimer’s. Since the 1980s, there have been some studies that linked elevated levels of aluminum in the body to cognitive decline. Since then, there have been studies that have not found a correlation. From here, some meta-studies2 showed a link and some did not. What does all of this mean? Is there a significant relationship or not? Should the public be alarmed? This example illustrates the types of problems created by focusing on the statistical significance and not discussing the conversational significance.
- The studies are confusing to the mainstream audience. This correlation without context is difficult for the layperson to process.
- What should the public do? Is the implication that they stop drinking soda out of cans or throw away their aluminum pots? Since aluminum is ubiquitous to modern society, how does one avoid it? Since people can prefer cans over plastics for another set of concerns (environmental and health), this can leave people feeling helpless.
- Since not all studies show a link, people can dismiss all this research and, indeed, discount all research as inaccurate.3 When the study focuses on a personal preference, like alcohol or caffeine, people will tend to remember the headline saying that their vice is OK and discount the headlines that challenge their vice. This, in turn, makes it harder for a clinician to provide guidance that a patient needs to hear.
- It implies that all significance is important to all audiences in the same way. Let us assume that reduction of aluminum would reduce the risk of Alzheimer’s by a relative 5%.4 (THIS IS NOT TRUE, JUST A MATH EXAMPLE.)
- The chances of an average person between 65-74 years old getting Alzheimer’s is about 3%. A relative 5% reduction drops those chances to 2.85%. I will leave it to the reader to determine if this 0.15% reduction is worth worrying about.
- There are currently an estimated 33.1 million Americans who are between 65-74 years old. That means that 9.9 million of them are likely to get Alzheimer’s. If that number dropped to 2.85%, that would mean a drop to 9.4 million Americans. Again, I will leave it to the reader to determine if half-a-million Americans is worth talking about.
The point is that there may be useful connections at a community-level that don’t necessarily trickle down to the individual. Or put another way, there are things that a community should care about that probably don’t need to be top-of-mind to the average individual.
- You only find what you are looking for. The reason people are, at times, finding a correlation between aluminum and dementia is because they were looking for it. There was research in the 1960s that pointed to a correlation in rabbits and so people set about to see if it was in humans. But focusing on this issue implies that it is in-itself important and perhaps more important than anything else. But any dementia researcher will readily admit that things like exercise, diabetes, and depression are far more important predictors of Alzheimer’s than aluminum.
This last point hints at another issue with statistical vs. conversational significance. Not only can this research get us to focus on small discrete things rather than broad issues, but they can also encourage us to focus on things that we cannot control. In my essay on patient demographics, I said that knowing that some people are easier to harder to satisfy means little when you have no control over who walks through your door. By obsessing about that, we often fail to address the things we can control.
Statistical significance also means very little without an underlying theory or concept. Statistical significance alone tells us very little. American College of Surgeons (ACS) established a sliding scale for trauma care, with Level 1 being the best and with other levels being marginally less awesome in turn. So, consider these questions:
- Does an ACS trauma designation have an impact on patient experience scores?
- If it does, would Level 1 have the best scores or the worst scores?
You might assume the answer to the first question is YES, since I asked it. The second question, though, is subject to interpretation. You might think the hospitals with the best trauma level would likewise have the best patient scores, since the patient knows that they are getting awesome care and reward the hospital. You might consider that those hospitals get the worst scores, since they are primarily focused on the shit-meets-fan cases so those people who don’t need that level of care may feel like they fell through the cracks.
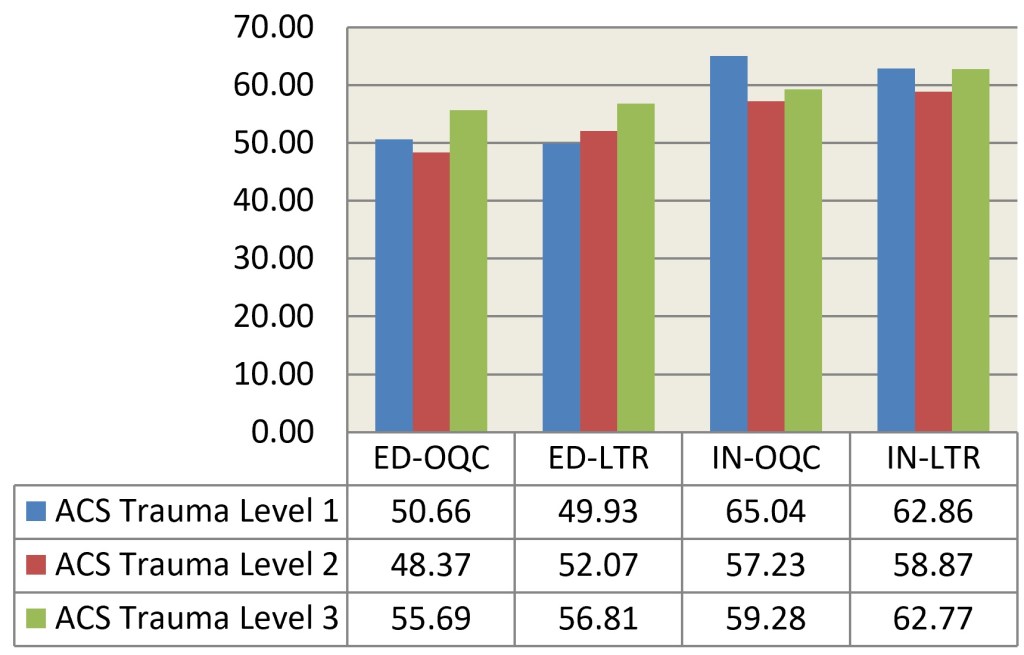
The data does not show any clear pattern.5 All the numbers for one designation listed above are statistically significantly different from the other designations. We see is that Level 1 hospitals sometimes have the best scores, sometimes the worst scores and sometimes their scores are in the middle. The Level 2 and Level 3 designations have the same pattern, where Level 3 performs better than Level 2. What theory conforms to this pattern? The reality is that there is no clear pattern. In fact, one could infer that if you cannot be Level 1, you are better off being Level 3. Heck, half of the time, you are better off being Level 3 than Level 1. The point of this example is that this research, due to its dataset size can identify small differences as significant. But it is not clear how useful this knowledge is. Without an underlying hypothesis it is difficult to make sense of these findings.
Now my thoughtful readers may observe that trauma designation has other values to a hospital or community than its impact on patient experience scores. Absolutely right! So that underlying hypothesis would say that this data has ZERO value at all. My fellow numbers nerds would read this and want to start parsing the data out more. Maybe emergency department data and inpatient data should be looked at independently. Maybe we need to dig deeper into more of the questions on the survey. Maybe there are some unidentified confounding variables, like all the Level 1 hospitals are in CrabbyTown and all the Level 3 are in HappyVille. Or that Level 1 hospitals tend to be big hospitals and Level 3 tend to be small hospitals. Again, great thoughts and worthy of exploration. But notice how those observations carry with them implicit hypotheses that say that trauma designation is not important at all or at least not as much as other variables not accounted for here.
In other case, having this data reported as statistically significant in a vacuum does not lead us to any useful secondary conversation. This is a designation that is difficult to control. A critical access hospital in a small town does not have the resources nor interest to be a Level 1 hospital, so this difference is unimportant to their day-to-day operation. Plus, the differences observed are often small. So, perhaps, there are more important things to focus on.
The reverse is also true. Just because something is not statistically significant does not mean we should not care about it. Whether a hospital is operating at a profit or loss, for example, does not impact patient experience scores, but I am hard-pressed to think of any administrator who would say that the ledger is an unimportant thing, nor a patient experience champion thinking that the long-run financial viability of a hospital is unimportant to the service they provide.
Now, at this point, you may question my statistical credentials, since I seem to be saying all significance is arbitrary and fleeting, there is no truth and we all die alone. First of all, I have only scratched the surface of my love/hate for statistics. Second, my point was not to challenge all statistics. It was to call out the fact that both statisticians and their audience will see a little asterisk signifying significance at a 95% confidence interval and that short-circuits their brain. That flag of significance may be important in helping the researcher validate their work, but it does not mean their work is useful. Just as no one should hate bad teachers more than good teachers and no one should hate bad cops more than good cops, no one should hate sloppy or duplicitous statistics more than good statisticians. Even if you don’t think of me as a good statistician, at least you know that I abhor the bad ones.
1So much of what I state in declarative sentences are not declarative. There are a few different ways to blur the line of significance, including where the confidence interval is set, or how you might tailor the data or recode variables to remove the noise.
2A meta-study is a study that takes the data from a bunch of other studies and smushes them together to increase the sample size to allow for smaller differences to pop as significant. As you might guess, I have thoughts on meta-studies, but not today.
3Thirty years ago, this was summarized in people making fun of scientific research about eggs—eggs are bad, eggs are good, eggs are bad, eggs are good. I am not sure if this example carries weight today, but there are countless other examples of conflicting research, like whether coffee is good or bad for you, when stripped of context, feel arbitrary.
4Another confusing stats term is a phrase like “a 5% reduction” which could mean a simple subtraction by five percentage points, or a reduction by a relative 5%. Imagine our starting percentage is 50%. A 5% reduction could mean 50%-5%=45%. Or it could mean subtracting 2.5% (which is 5% of 50%), so 50%-2.5%=47.5%. For some reason, this concept less intuitive when talking about percentages than in any other space. No one would go a store, see a 40% Off sign and be confused as to the bargain.
5The long version of the data explanation I will save for another day. For the moment, OQC stands for a patient’s rating of the Overall Quality of Care and LTR stands for Likelihood to Recommend.

Leave a comment