In Part 1 of this essay series, I focused on how a few often-used concepts taken from math and used in healthcare, like percentages and likelihoods, can lead to confusion in patients. In Part 3, I spoke about how humans are not necessarily the most centered and rational when it comes to conversations about these percentages and likelihoods, especially when they surround very large and very small numbers. Patients with a thousand other things on their minds are even less so. Both essays assume good intent. That is, that we are trying to communicate as clearly as possible so the best decisions can be made. But when the math concepts are used by people who are, at best, poorly-trained on how to use them properly or, at worst, looking to manipulate an audience, we cannot simply tell the public to do better. The material thrown at the public and patients, is overwhelming and telling them that they need to do better to understand it, even as others are trying to confuse them seems at best tone-deaf and at worst cruel.
The most basic example of this is how percentages are used to catch the eye and add dramatic weight to a fact but represent things that are really not that noteworthy. There are certainly plenty of examples of this, but a while back when I was building a grand rounds presentation on statistics, I came to this specific example. Not sure why, but it resonated with me and while it is a bit dated, I still think about it and it still chaffs me.
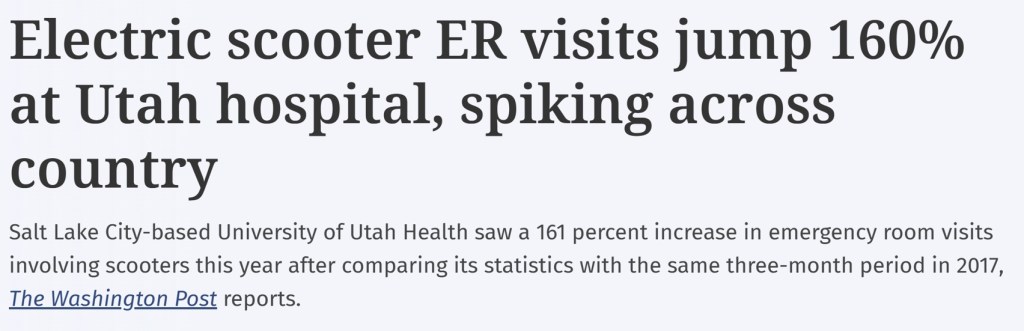
This headline is certainly noteworthy. You immediately wonder:
- How did this happen?
- Why have I not heard of this before?
- We need to do something!
- Of all the things I must worry about, and now there is this?!?
It is alarming in part because it seems so unexpected. But then if you start reading the first paragraph and see the numbers, you might realize that perhaps we jumped into panic a bit quickly.

Once you read the article, you realize that the jump being reported is from 8 injuries in 2017 to 21 injuries in 2018. That is an increase of 13 injuries, which is actually a 162.5% increase over one year. Now, please know that I am not making light of the situation. Any one injury can be traumatic for those involved. But, if you didn’t read past the headline (and how many of us do that, in our doom-scrolling mindset), you might think that this is a major epidemic. In reality, while it may bear watching, it is unclear from this article if this can even be considered a ‘trend.’ I pulled some additional numbers from the internet simply to show how framing a message impacts the message. How do each of these true statements impact your concern over this issue?
- Utah Health saw a 162.5% increase in scooter accidents in one year.
- Utah Health saw scooter accidents increase from eight to twenty-one in one year.
- Given that Utah Health sees about 50,000 patients in their emergency department every year, they saw an increase of patients with scooter accidents go from 0.016% of their patient population to 0.042% of their patient population.
I will not speak about which one is ‘right’ since they are all accurate. This isn’t about what is right, so much as how we can position or frame our message by using the numbers in very specific ways.
Now, you might rightly point out that in 2018, electric scooters were a novelty, and this article was really trying to sound the alarm about the potential of a new heath care risk on the horizon. Here are some contemporary numbers. In 2024, nationwide, there were 118,485 electric scooter accidents that resulted in a trip to the emergency department. These accidents accounted for about 0.076% of all the 155 million emergency department visits that year. So, it is true that as the scooter’s presence grows, so does the risk. Of course, it is also true that falls from ladders accounted for at least 164,000 ED visits over the same time. So, while both are problems, neither has yet positioned itself as a major public health crisis. Or, if I wanted to generate some clicks, I would point out that going from 0.042% to 0.076% constitutes an 81.5% increase in emergency department utilization in just seven years! Yikes!
Again, in this polarized world, I am not saying we should IGNORE the public health problem that electric scooters on every street corner pose. People should be aware of the risks both as riders and pedestrians. What I am saying, though, is that when people frame problems in the most catastrophized way, it leads to the numbness of the population. If everything is shocking, then nothing is shocking. You might be one who bounces from one alarming problem to another and in the process forgets about the crisis posed by the previous alarming problem. You might be one who rejects the harm of everything saying, “I could live right and still get hit by a bus tomorrow.” Either way, there is no effort made by you to bend the public health curve posed by any of the risks.
A lot of popular coverage of medical research falls into this same category. How often have you seen a headline that trumpets that Action X has a 334% increased chance of leading to Disease Y? Once digging into the numbers, you realize that 4 of the 804 people in the control group developed Disease Y, while 17 of the 788 people in the test group developed Disease Y. Even if this is statistically significant it may not be conversationally significant. It might not even be able to be replicated in another set of patients. Again, this is not to suggest that the findings are worthless, but to remind everyone that it is only one datapoint. If it is a single datapoint that supports other datapoints, it becomes another grain of sand on the scales, tipping them towards truth. If it is a single datapoint that challenges all the other datapoints, its extraordinary claim better provide some extraordinary evidence, to paraphrase the Sagan Standard.
Now these stories resonate with us precisely because they boil complex issues down to simple equations thereby feeding our desire to control things. If I wear sunglasses, I won’t get macular degeneration. If I don’t smoke, I can’t get lung cancer. There are things that can reduce the risks of bad things happening to you (like not smoking); there are things that can minimize harm, should a bad thing happen to you (like wearing a seat belt). But treating complex issues with this sort of dichotomy tends to be problematic. You can die in an auto accident even if you do wear a seat belt. Non-smokers still get lung cancer. Since the causal relationship is not 1-to-1, reliance on these relationships may make it easier to pigeonhole them, but it also can make it easier to dispute them. A perfect example of this is how cigarette companies were able to discount, dismiss, and downplay the damage caused by their product for over fifty years.
This does not just describe those people who are simply trying to explain events to the mass public. It also can cover experts using complex models and equations to make scientific discoveries. Some estimates suggest that about a quarter to a third of research papers published in peer-reviewed journals contain information that includes Type 1 and Type 2 errors. Beyond this, there are certainly researchers who have shaded facts, sculpted data, or just lied about what their findings really mean.
There is a special place in hell, though, for those who misuse terms either out of their own ignorance or to purposely deceive an audience. This effort makes it even more difficult for the public to separate truth from fiction. They are not simply reframing data to attract attention but playing games to manipulate outcomes.
A classic example of this is how the terms “survival rate” and “mortality” have been used to purposefully make identical outcomes look different. To score points, a politician was crowing about the fact that the survival rate of prostate cancer was greater in the US than in England, thereby arguing against “socialized medicine.” He was right: the 20-year survival rate for prostate cancer in the US was better than it was in England. But when asked why the mortality rate for prostate cancer the same in both countries was essentially, he had no answer. If you want a brain puzzler, you can pause and try to explain how the mortality rate and life expectancy for prostate cancer is the same, even if the US has a higher survival rate. When you are ready, review this graphic.
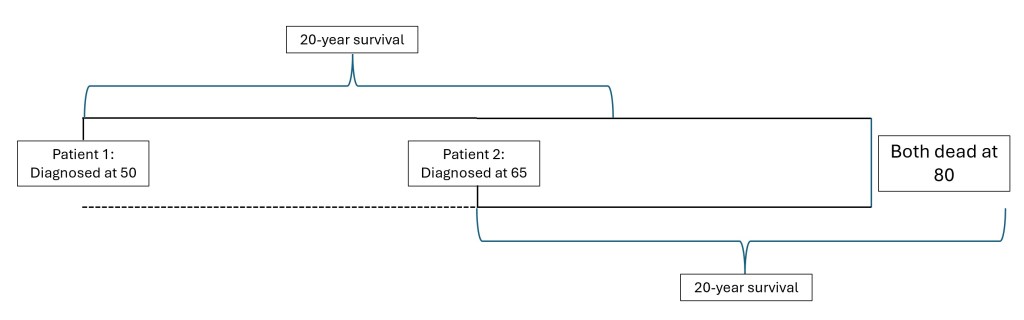
The graphic above illustrates how all of this could be true. The variable not accounted for in the politician’s stump speech was that the main difference between the two patients was when the cancer was detected. American men were getting screened earlier and more aggressively than British men, so they were finding the prostate cancer earlier. Therefore, the 20-year survival rate looks better for the Americans. But neither group is living longer or less likely to die from it.
To be clear, this is not meant to be a statement about my feelings about structures for delivering care. We could grab a beer and discuss which patient had a better quality of life—the guy who got to live blissfully unaware of the cancer, or the one might have felt more in control of his diagnosis because he got it earlier. We could also discuss whether early detection is better or worse, given both the possibility to try multiple treatments as well as the possibility of false positives (as discussed in the first essay in this series.) And, being prostate cancer, we could discuss the emotional impact of spending more of his time sexually impotent or suffering from the side effects of the cancer treatment. This essay is only interested in how the framing of the conversation can change how people perceive the conversation. If the people doing the framing are doing it precisely to deceive, well, the most charitable response I can have for that is YOU ARE NOT HELPING ANYTHING.
Yes, people should not just read the headlines. They should not assume everyone is being as truthful as they can be. They should not assume that people (including me) don’t have blind spots or perspectives. That is about having an informed population. But people need to function in an environment where they can have some level of trust in the messages that they are getting. We cannot be naïve, but we likewise cannot be cynical. Neither will make us good consumers. Not of electric scooters and not of healthcare.

Leave a comment